Which QBs Need Help Next Season
With Free Agency and the NFL draft coming up, which QBs are in need of help before next season?
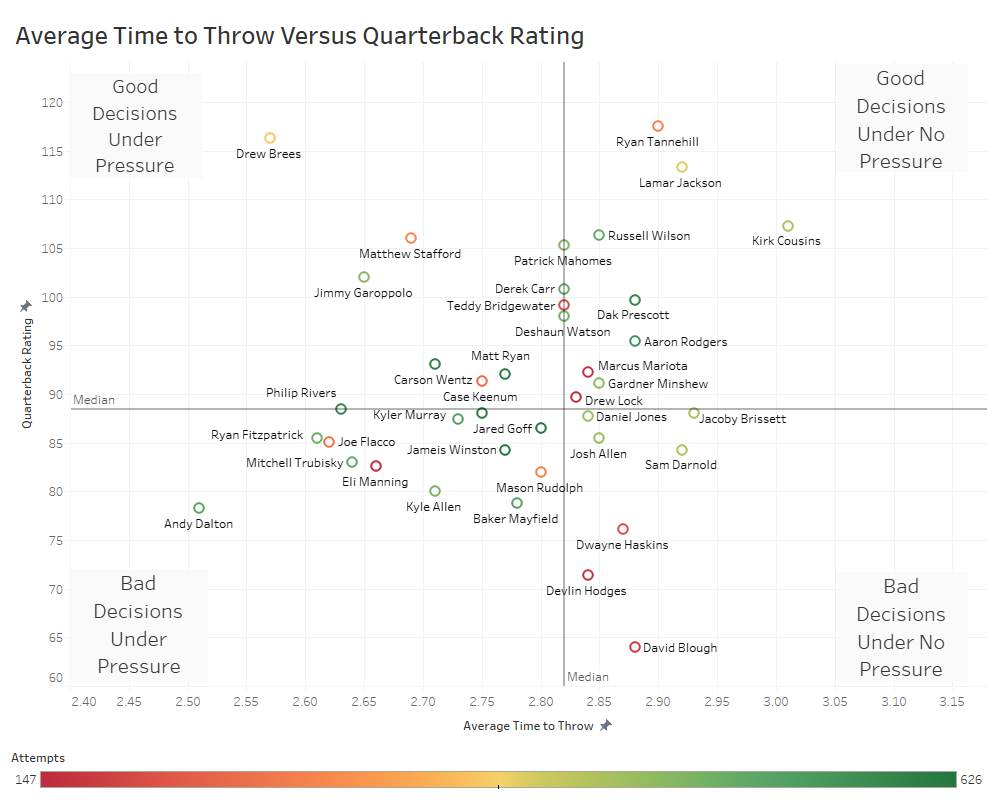
In the first plot below, average time to throw is plotted against Quarterback Rating. Time to Throw is a stat from Next Gen Stats that measures the average amount of time elapsed from the time of snap to throw on every pass attempt for a passer (sacks excluded). Shorter time to throw over the course of a season can be taken as an indicator of the strength of an offensive line.
What graph 1 represents is which Quarterbacks make the most of the precious time they are given to throw the ball. Being in the top two quadrants suggests these were the better quarterbacks in 2019, though some of these quarterbacks had less time than others. Meanwhile, quarterbacks in the bottom right quadrant will look to improve in 2020 as they had plenty of time to throw (relatively) but made poor choices. Teams in the left two quadrants will look to give their quarterbacks more time to throw in 2020. Intuitively, the more time they have to throw, the better their stat lines may become. Alternatively, the story here could be the scheme a quarterback is in. For example, lots of quicks reads and throws.
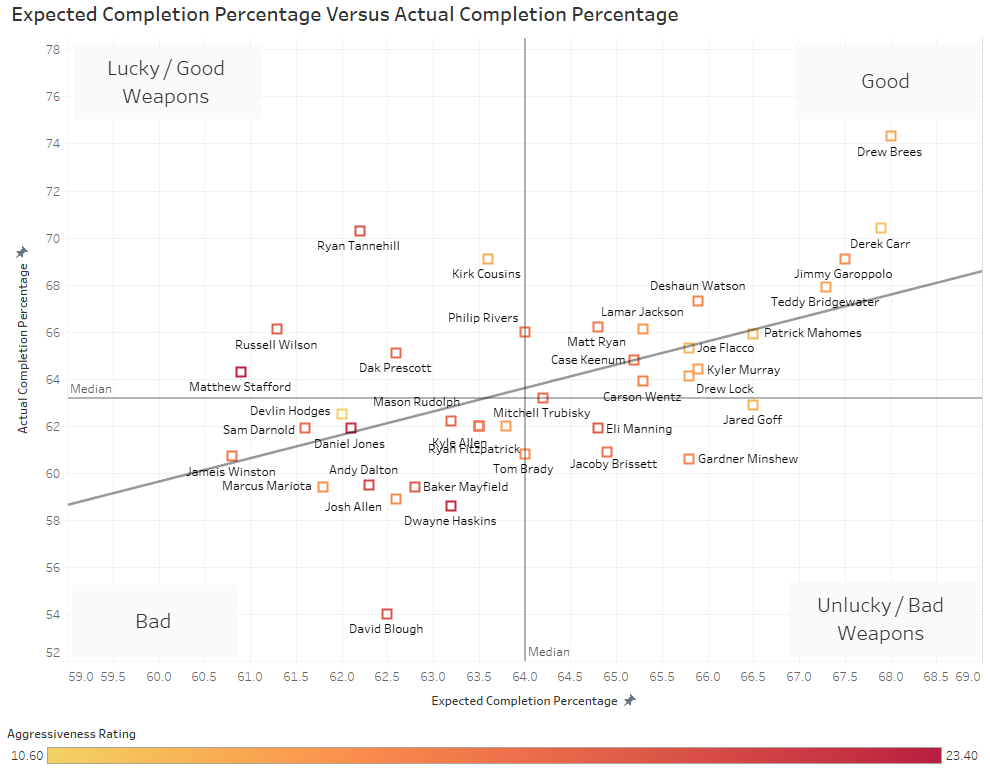
In the second plot, we have quarterbacks expected completion percentage plotted against their actual completion percentage. Expected completion percentage is calculated based on numerous factors such as receiver separation from the nearest defender, where the receiver is on the field, the separation the passer had at the time of throw from the closest pass rusher, and more. Once that probability is calculated on every play, an expected completion percentage for that QB is calculated. The difference between the actual completion percentage and expected completion percentage has multiple interpretations. If actual completion percentage is above expected completion percentage, it could mean the QB is ‘lucky’ or that his receivers make him look better than what his throws warrant (or both).
Conversely, if the actual completion percentage is below expected completion percentage, the QB could be ‘unlucky’, or his receivers are making him look worse than his throws suggest (or both). The colouring of points of this graph corresponds to the percentage of that QBs throws, which are ‘aggressive.’ Aggressiveness as a stat tracks the amount of passing attempts a QB makes that are into tight coverage, where there is a defender within 1 yard or less of the receiver at the time of completion or incompletion. These aggressive attempts are then divided by the QBs total pass attempts. The diagonal in the graph represents where Expected completion percentage is equal to actual completion percentage. So anyone below the diagonal was completing less than expected and anyone above was completing more than expected (given the passes they threw).
What Graph 2 represents is which quarterbacks are getting help from their weapons, and which are not. If a quarterback is in the bottom left quadrant on graph 2, this does not necessarily mean he has bad weapons. The Quarterback himself may just be bad since his expected completion percentage is low to begin with. Notice that most quarterbacks with low expected completion percentages also tend to be a little more aggressive. The top left quadrant features quarterbacks who are overachieving given the passes they threw in the 2019 season. This overachievement could be because they are lucky (for example tipped passes and misplays by the defence) or it could be because they have great weapons (or both). So is Dak Prescott worth what he is asking for in his contract talks?
Meanwhile, there are some quarterbacks which either got unlucky in 2019, or their receivers let them down (or both). Look for New England, Jacksonville, Indianapolis, the LA Rams, and Chicago to consider improving their offensive weapons this offseason.
Data for this post came from Next Gen Stats.Graph were for QBs who had more than 128 pass attempts in the 2019 season. Good/Bad Weapons = Good/Bad Receivers around a particular Quarterback in question. Please note that the quadrants for both graphs are defined by the medians of each axis. This analysis is relative in nature, not absolute.


