Value in the NBA Draft
A draft in any sport is a night full of optimism for teams, prospects and fans. No matter what position a team is drafting from, they will be looking for someone who will contribute meaningfully for years to come. The franchises who assemble a roster that consistently wins year after year is usually not the same franchise that spends big in free agency, it is typically the franchise that drafts and develops well. What does it mean to draft well? To me, it means a team identifies players who fit their system and culture, but most importantly, they provide value above what one would expect based on where they were selected.
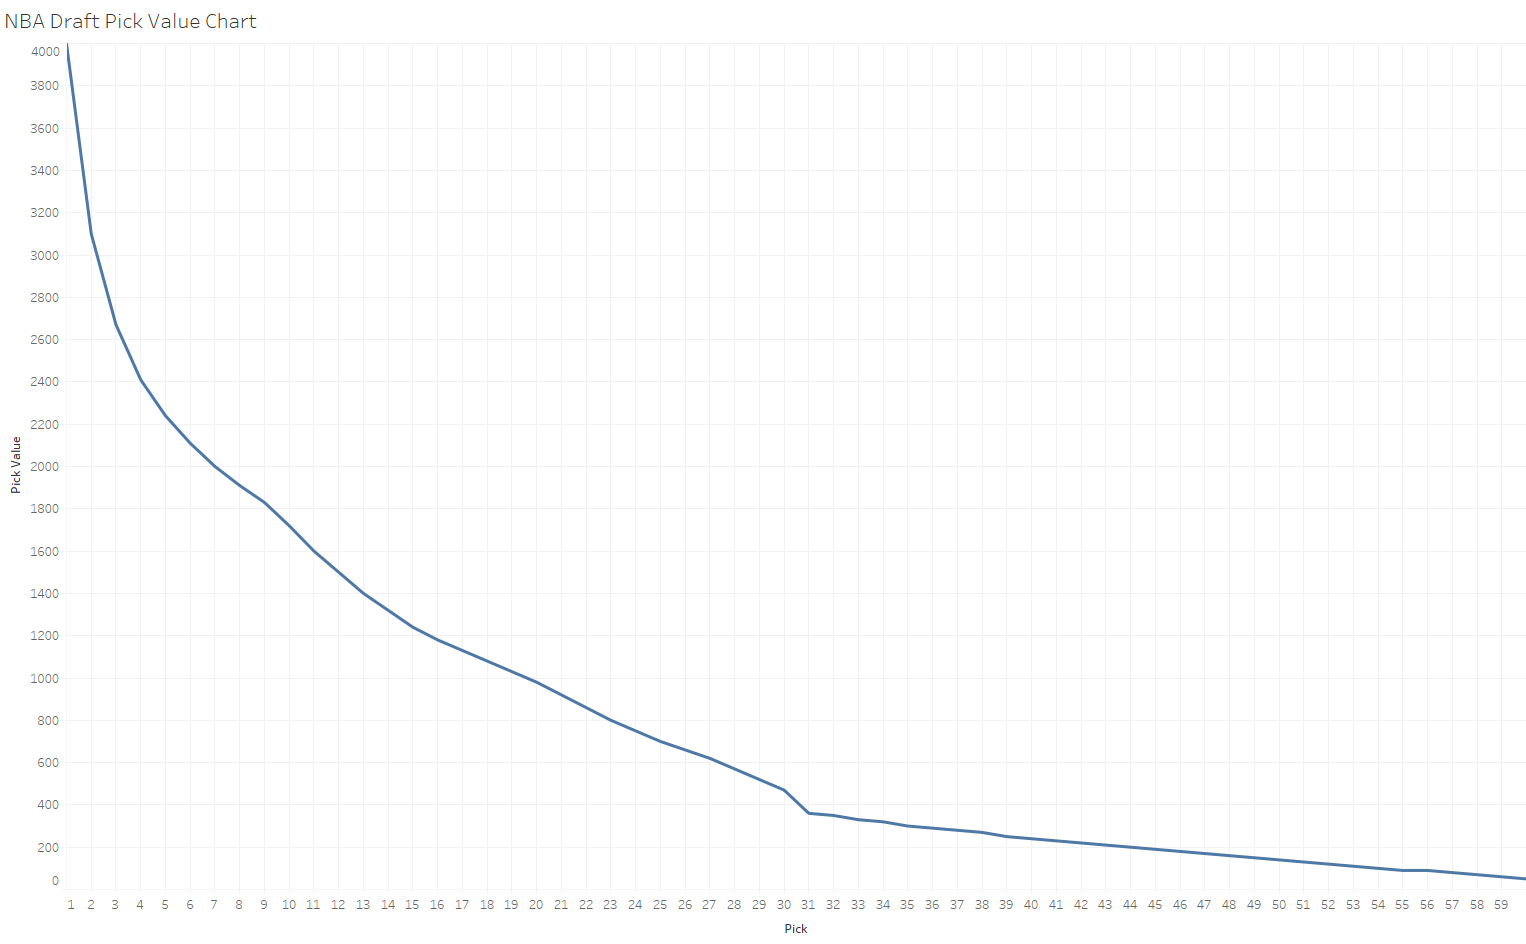
Most sports have pick value charts for drafts. These charts, like the one below for the NBA (obtained here), represent a theoretical value for every pick in a typical draft. The numbers assigned to each pick do not mean anything on their own, but when compared with each other, they represent the value of each pick in terms of other picks. Naturally, the value of each pick decreases exponentially.

The following analysis below is a simple, back-of-the-envelope calculation of which teams get the most out of drafts. This analysis relies on a catch-all metric and can be applied similarly to both baseball and hockey. Where this analysis is difficult to use is football since comparing the impact of players in different positions is challenging to do. The catch-all metric I use for this analysis is win shares. Roughly speaking a win share is how many wins a player accounted for with his play during the season. Win shares can be negative, which would imply that a player is so terrible he is helping the team lose. If you add up the win shares of every individual on a team, you should get a number which is close to the actual number of wins the team had that season.
Thinking about a draft in any sport, it makes sense to believe that whoever is picked at number 1 should have the most win shares of anyone in that draft class. Then the player selected at two should have the second most, and so on. In other words, whoever is selected at one should be the best player from that draft class. Otherwise, why was he picked at one? If the team picking number one does not leave with the best player, isn’t it a failure on their part? Conversely, if a team is picking late in a draft and leaves with one of the top players, that is an enormous victory for that team – they got more value out of a selection than expected.
This analysis, of course, benefits from hindsight, but teams in many sports have tons of resources at their disposal, so why can’t they identify the right players at their draft position? And if they can’t, why don’t they trade down?
Players in each draft class are compared in the following way. First, the theoretical value of the pick they are chosen is scaled using min-max normalization. The same is done to that players’ career win shares to date. This normalization is done with players in every NBA draft back to 1989. Note that players are only being compared to other players in their drafts. It is not fair to compare players across selections since wins shares is a metric that would typically be higher when a player has played more games. This also means that even if a player is “better” than players picked behind him, if he cant stay healthy, he is less valuable (for example, Derrick Rose). Finally, win shares can be negative, meaning that under this analysis, if a team drafts a player and he never steps on an NBA court, that is better than a team drafting a player who gets on the court and helps the team lose (he produces negative win shares).
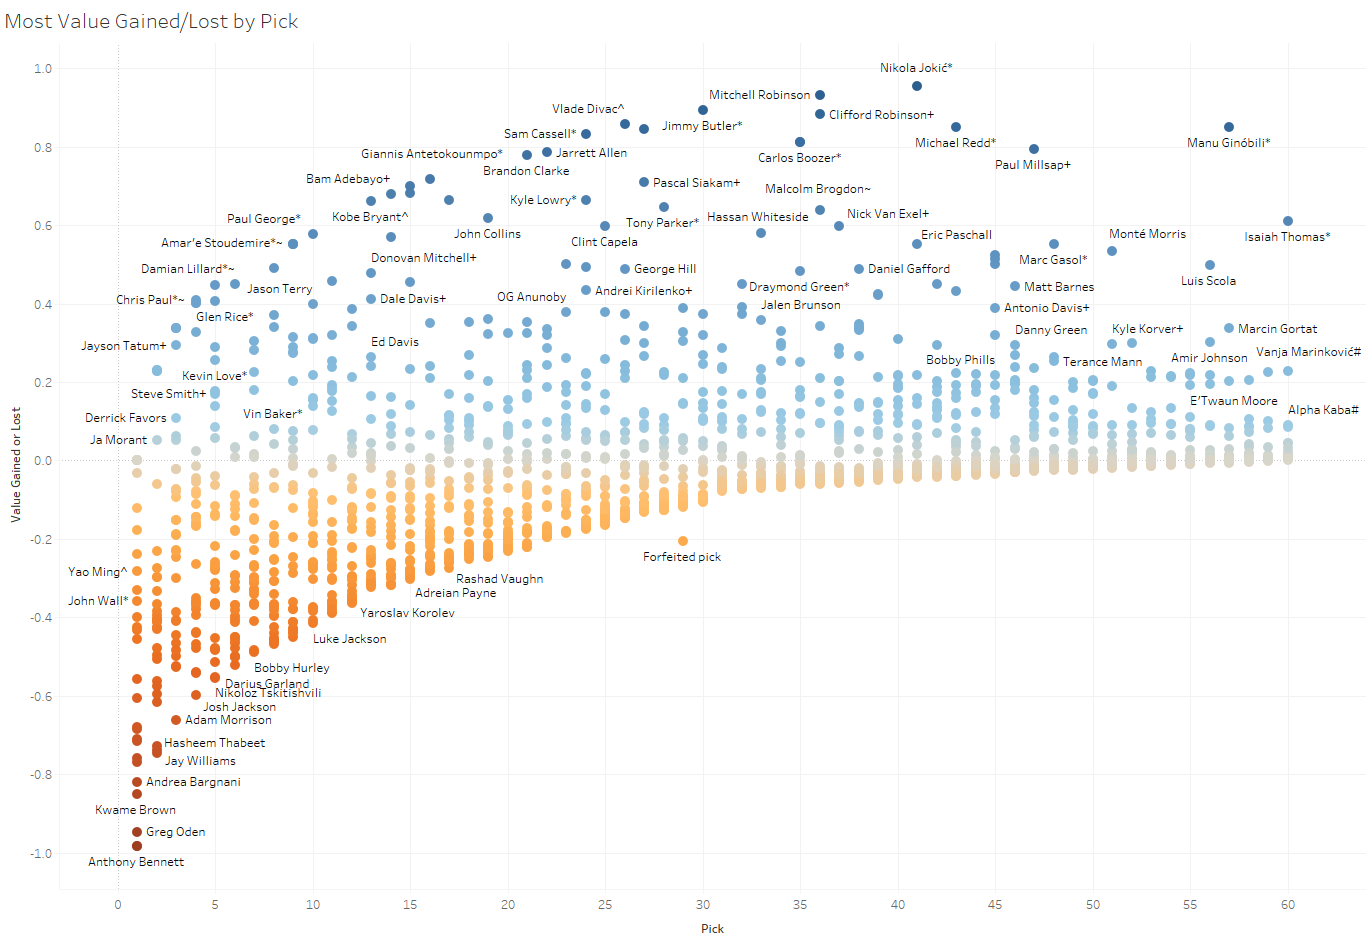
Once these two normalizations are done, the difference between the draft pick normalization and the win share normalization is taken – giving us a number for the value of each pick in that draft. Since the number 1 pick has a value of 1 in the normalization, if that team does not pick the best player, they get a negative, and even if they choose the best player, the value they get is 0 because they should have gotten the best player anyway. In other words, there is no such thing as a ‘steal’ with the number one pick. It is the worst spot pick at in some sense because all the pressure is on that team.
Some NBA drafts break this method rather easily. For example, the 2003 Draft. Since the normalization is based on the min and max values, Lebron James makes Carmelo Anthony, Dwyane Wade, and Chris Bosh look bad.
So which players are responsible for the most value gained/lost by pick?

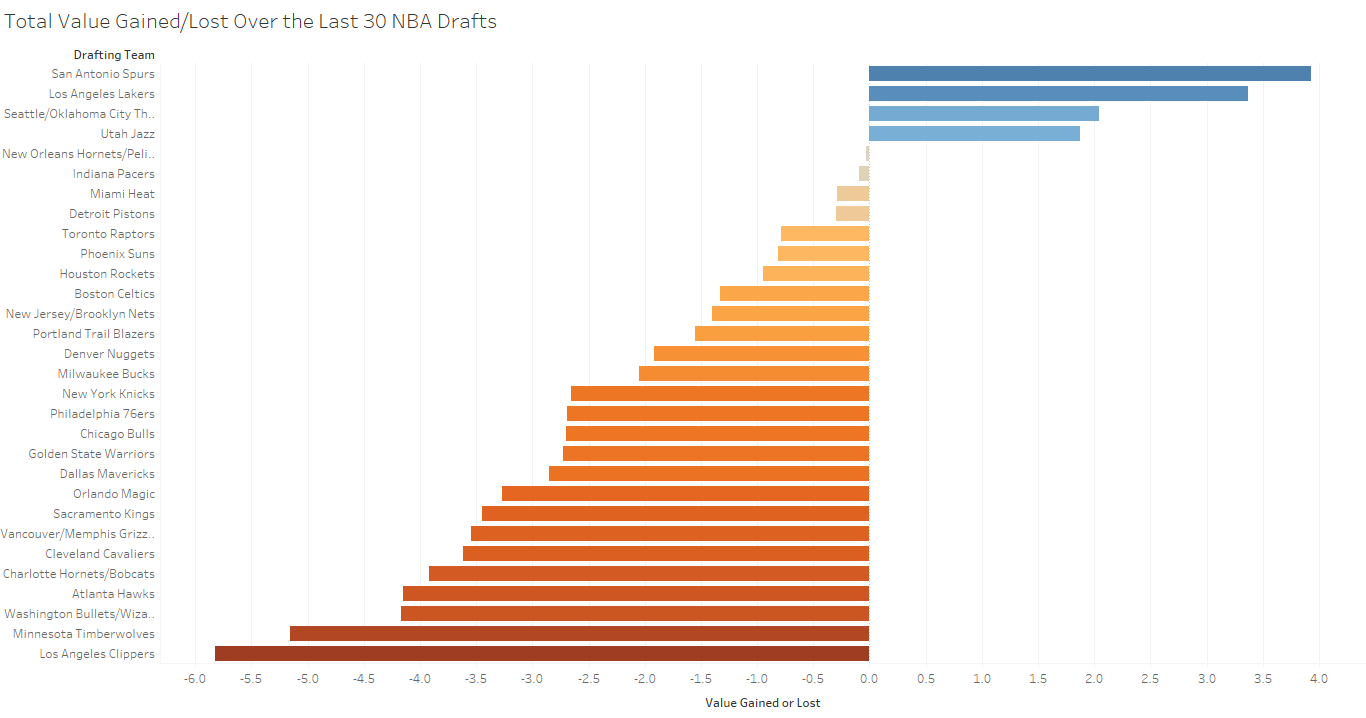
Which teams have been the best/worst at drafting over the last 30 years?

How have team drafts gone overtime? Please see here on Github.
Data for this post came from Basketball Reference. It can be found on Github here
