The Hidden Side of Moneyball
The movie Moneyball came out in 2011 and was based on Michael Lewis’ book. The film made 110.2 million USD at the box office and scored a 94% on Rotten Tomatoes. Moneyball focused on the 2002 Oakland A’s and how, despite losing three key players (Johnny Damon, Jason Giambi, and Jason Isringhausen), the A’s, with the help of some analytics, were able to make it back to the American League Playoffs despite their relatively minuscule payroll.
In the film, the A’s brought in David Justice, Scott Hatteberg, Jeremy Giambi, and Chad Bradford to replace Damon, Giambi and Isringhausen (Note that Jeremy Giambi was later traded for John Mabry). It is worth Noting that Chad Bradford and Jeremy Giambi actually already played for A’s in 2001. As the movie would have you believe, they played a considerable part in Oakland’s success the following season… But did they really?
As pointed out in The Sabermetric Revolution, Moneyball leaves the viewer with the impression that the centrepieces of the team were Hatteberg, Giambi, Justice, and Bradford. While these guys were no scrubs, they combined for only a 7.2 wins above replacement (WAR) during the 2002 season.
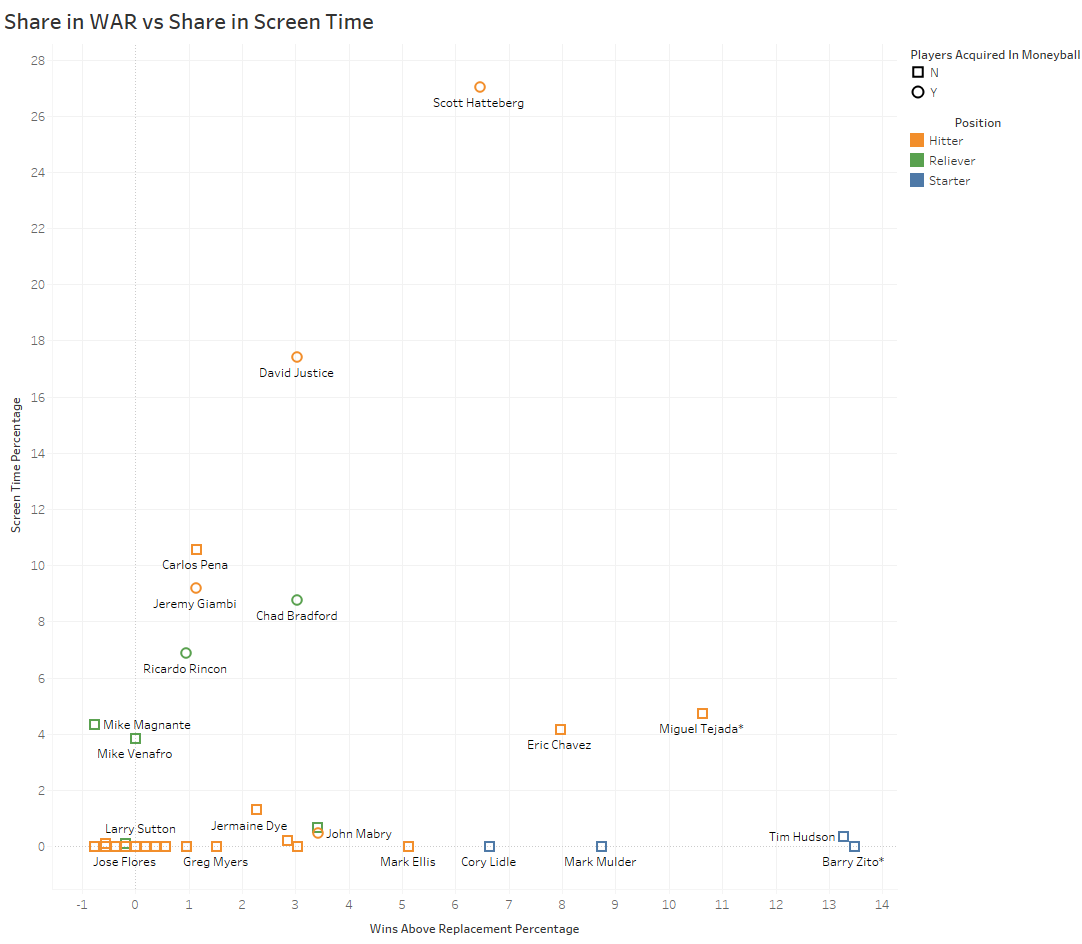
In reality, the A’s already had a great team in place – Eric Chavez the five-time gold glover, Miguel Tejada the six-time all-star and the American League MVP in 2002, and the two-time all-star Jermaine Dye. Something which is also wholly ignored is how good the A’s pitching was in 2002 – led by an excellent pitching staff which included 2002 American League Cy Young winner Barry Zito. However, these great players were largely ignored. So how much screen time (measured here as seconds being talked about in the movie plus seconds on the screen) did each player get relative to their value?

Under this comparison in the graph above, if each player was shown in the movie for an amount of time equal to how valuable they were to the team, the line would be a 45 degree line from the origin. However, we can see from the graph above that Oakland’s top six players (According to WAR), including the AL MVP and the AL Cy Young winner, were largely ignored in the film. Further, Oakland had quite the starting rotation in 2002, something which was never mentioned in the movie. More bizarrely, the players who received the most attention on the screen were, at least on the field, of lesser importance to the team over the course of the season. It is worth noting as well that this metric of screen time is also quite generous to Chavez and Tejada – their names were rarely mentioned in the movie, and when they did appear on the screen, a regular viewer wouldn’t know who they were – they look like regular teammates.

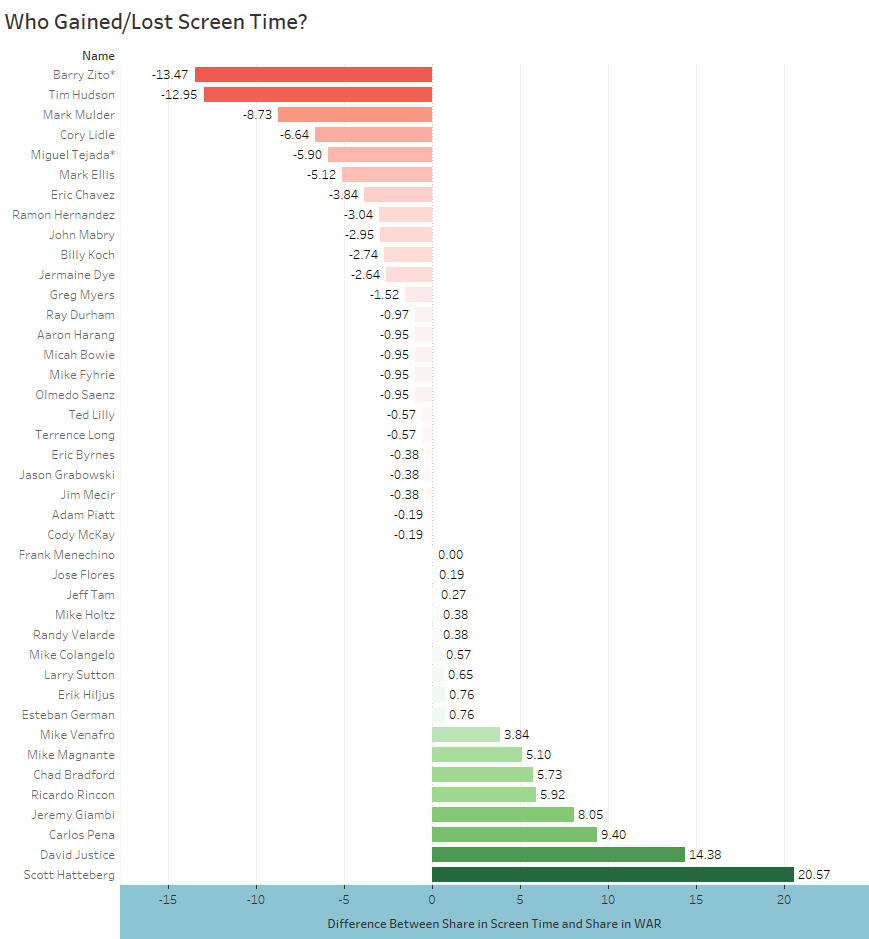
Which players deserved more screen time for what they brought to the team? Taking the difference between their percentage of screen time and percentage or WAR suggests that film should have focused more on the team’s starting rotation as well as Tejada and Chavez. Moneyball allocated more of the story of the 2002 A’s to players who were brought in because of sabermetrics. However, these players were less critical to the team making it back to the American League Playoffs. This allocation taints where viewers think the majority of success that season originated. Despite this, Moneyball generated a lot of buzz around the sports analytics world and without the movie (and book), the topic may not be as popular as it is today.
The original discussion of this critique of Moneyball can be found in chapter 1 of The Sabermetric Revolution. This post is an extension of that chapter which takes the discussion and tests it with data from the movie. The data used for this post is available in an Excel file in NumberHound’s data repository on Github.
